Resting Heart Rate Diagnostics: Track Real Fitness Gains
Why Resting Heart Rate Matters for Fitness
Ever wondered what a single number on your wrist can tell you about your health? Resting heart rate (RHR) is an accessible, objective biomarker that reflects cardiorespiratory fitness, autonomic balance, and recovery. Tracking it over weeks and months reveals trends that one-off workouts or the scale cannot.
This article shows how to measure RHR accurately, how to interpret meaningful changes, and how RHR applies across different training goals and populations. You’ll learn practical thresholds, common pitfalls, and how to use RHR to guide adjustments in training load and recovery.
Read on for a clear, practical plan to collect reliable RHR data, turn it into actionable decisions, and troubleshoot noisy or conflicting signals so your progress reflects real fitness gains consistently.
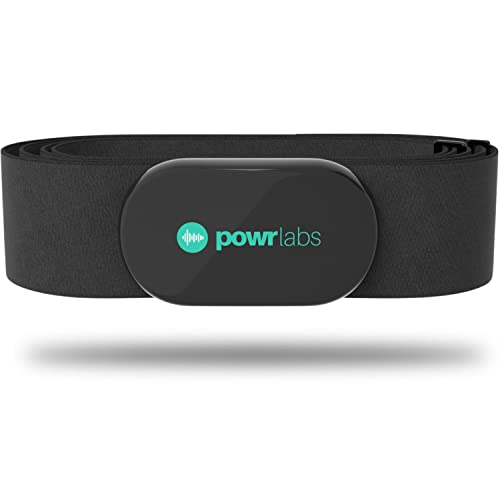
Best Value
Amazon.com
Powr Labs Bluetooth & ANT+ Chest Heart Rate Monitor
Are You Building Muscle? Simple Signs You’re Gaining Strength
1
The Physiology Behind Resting Heart Rate: What RHR Actually Shows
The pacemaker and autonomic balance
Your RHR starts at the sinoatrial (SA) node—a cluster of pacemaker cells in the right atrium that sets the baseline beat. That intrinsic pace is continually modulated by the autonomic nervous system: sympathetic tone (adrenaline/norepinephrine) speeds the heart, while parasympathetic (vagal) tone (acetylcholine) slows it. Small shifts in stress, caffeine, or sleep can tilt that balance and raise or lower your RHR by several beats per minute.
Feature-Packed
1.83" HD Smartwatch with Alexa and Calling
Built-in Alexa and Bluetooth calling, 120+ sport modes
Large 1.83-inch HD touchscreen smartwatch with built-in Alexa, Bluetooth calling, and 120+ sport modes to track workouts. Provides continuous heart rate and sleep monitoring, notifications, and multi-day battery life for everyday use.
Stroke volume, cardiac output, and training adaptations
Heart rate and stroke volume together determine cardiac output (Q = HR × SV). Endurance training increases stroke volume—each beat ejects more blood—so at rest the heart can maintain adequate output with fewer beats. Over months, athletes commonly develop greater vagal tone and larger left ventricular chamber size, producing a lower RHR (think mid-40s for well-trained endurance athletes versus mid-60s for typical active adults).
A quick real-world note: a recreational runner who adds consistent aerobic volume often sees RHR drop 3–8 bpm across 8–12 weeks; a sedentary person starting exercise may see larger initial changes.
RHR vs other heart-rate metrics
Maximum heart rate: the upper limit during intense exercise (often approximated by 220−age) — unrelated to resting pace.
Heart rate variability (HRV): beat-to-beat variation reflecting vagal tone; complements RHR as a recovery metric.
Heart rate recovery: how quickly HR falls after exercise — a fitness marker distinct from resting values.
Typical ranges and what influences them
Adults: ~60–100 bpm (clinically normal), though many healthy adults are 50–70.
Trained athletes: commonly 40–60 bpm.
Children and teens: higher RHRs; newborns much higher.Influences: age, sex (women slightly higher on average), genetics, medications (beta-blockers lower RHR), hydration, illness, and baseline fitness.
Strengths and limits of RHR as a fitness signal
Strengths: easy to measure repeatedly, sensitive to training and recovery trends, and great for longitudinal tracking. Limits: a single RHR reading is nonspecific—illness, sleep loss, stress, or drugs can mimic fitness changes. RHR won’t precisely quantify VO2max or detect all cardiac issues.
Next up: practical approaches to measuring RHR reliably so your trends reflect real fitness improvements, not noise.
2
Measuring Resting Heart Rate Accurately: Methods and Best Practices
When and where to measure
The cleanest RHR snapshot comes in the first minutes after waking, before you sit up, check your phone or drink coffee. Measure while supine for the lowest variability; seated is acceptable if supine isn’t practical, but expect a 2–5 bpm difference. Make this a routine: same bed, same position, same time of day to reduce noise.
Duration and protocol
For a single reading: count beats for 60 seconds (or use a device’s 60‑second average) to avoid short-term fluctuations.
For trend quality: average readings across multiple mornings — 3–7 consecutive days gives a reliable baseline; 7–14 days is ideal when establishing a new baseline after a training change.
Controlling variables
Small things move RHR. Control or log these to interpret changes:
Sleep quality and duration
Alcohol or caffeine within 12–24 hours
Intense exercise in the previous 24–48 hours
Acute illness, fever, or chronic medications
Room temperature and hydration
If any of the above occurred, tag the reading — that makes later filtering far easier.
Tools: pros, cons, and when to use each
Manual pulse (neck/wrist): universally available, zero tech; good for spot checks but prone to human error and short counts.
Chest-strap ECG (most accurate for RHR and exercise): clinical‑grade signal, consistent at rest and during activity. Ideal for athletes and research-quality tracking.
Most Accurate
Polar H10 Waterproof Chest Heart Rate Monitor
Clinically recognized for supreme accuracy and versatility
The Polar H10 is a professional-grade chest strap delivering top-precision heart rate tracking with Bluetooth, ANT+ and 5 kHz connectivity. Its comfortable strap, waterproof build, and internal memory make it ideal for serious training and wide device compatibility.
Wrist optical sensors (smartwatches like Apple Watch, Fitbit, Garmin): convenient and comfortable; accuracy at rest is generally good for trends but can be affected by fit, skin tone, and movement.
Dedicated bedside/overnight monitors (Withings, Emfit, consumer ECG mats): excellent for long-term nocturnal baselines, especially if you prefer passive, continuous data.
Choose chest straps when you need precision (training studies, heart-rate variability work) and wrist or bedside devices for convenience and daily adherence.
Record daily morning RHR with a short note on confounders.
Use a 7‑day moving average or weekly median to visualize trends; medians blunt spikes from outliers.
When to exclude: clearly abnormal readings tied to illness, sleepless nights, or device error — mark and omit from baseline calculations.
Missed days: don’t over-interpolate. One missed reading is fine; multiple gaps justify recalibrating the baseline window.
Next, we’ll look at how to interpret those trends — what magnitude and timing of RHR change actually indicate improved fitness versus temporary noise.
3
Interpreting Changes in Resting Heart Rate: What’s Meaningful
Typical day-to-day variability and what counts as “real”
Most healthy adults see small daily swings in morning RHR — typically 1–3 bpm if you measure consistently. Outside factors (poor sleep, late alcohol, travel) can push that to 5–10 bpm for a day or two. As a practical rule: don’t chase single-day blips. Look for sustained shifts.
All-Rounder
AMOLED Fitness Tracker with Heart and Sleep Monitoring
1.10-inch AMOLED, 25+ sport modes, health sensors
Compact smartwatch featuring a 1.10-inch AMOLED display that monitors heart rate, blood oxygen, blood pressure, and sleep while supporting 25+ sport modes. Includes notifications, reminders, and other smart features to support daily fitness and health tracking.
Short-term spikes (1–3 days): usually sleep deficit, late-night drinks, acute stress, dehydration, or a minor illness. Example: after a sleepless night, your RHR might jump 6 bpm but return after 48 hours of recovery.
Medium-term drift (1–2 weeks): could signal accumulating fatigue or a response to a new training block.
Long-term decline over weeks to months: classic sign of improved aerobic efficiency — think slow, steady drops of 2–6 bpm across 4–12 weeks with consistent training.
Simple analytics you can apply today
Baseline: collect 7–14 consecutive morning readings under consistent conditions to set your baseline mean and note its standard deviation (SD).
Rolling average: use a 7‑day moving average to smooth noise; plot it to visualize trends.
Heuristic significance test: flag a change when the 7‑day rolling average shifts by more than either 1 SD of your baseline or 3 bpm (whichever is smaller) and that shift persists for ≥7–14 days.
Quick example: baseline mean = 60 bpm, SD = 1.5 bpm → flag when 7‑day average moves >1.5 bpm for two weeks.
Actionable thresholds and warning signs
Positive signal: gradual decline of ~2–6 bpm over 4–12 weeks alongside performance gains and low perceived exertion = improved fitness.
Caution: sustained increase of 3–5 bpm above baseline for 1–2 weeks suggests inadequate recovery; reduce intensity or increase rest.
Red flag: rise ≥5–10 bpm sustained over several days, especially with symptoms (fatigue, sore throat, fever) — consider pausing heavy training and seek medical advice if symptoms persist.
Special cases: elite athletes may treat 1–2 bpm shifts as meaningful; casual exercisers should wait for larger, sustained changes.
Use these simple rules as your decision engine: establish a clean baseline, smooth with a 7‑day average, filter out known confounders, and act when changes exceed your personal variability for more than a week.
4
Using RHR to Track Different Training Goals and Populations
Training goals: what to expect and how to read RHR
Endurance (running, cycling)
Typical RHR trajectory: slow, steady declines of 2–6 bpm over 4–12 weeks with consistent aerobic volume increases.
How to use it: pair RHR drops with time‑trial improvements (5K/20K or FTP). If RHR falls but pace/FTP stalls, look for overtraining or technique limits.
Quick tip: expect transient rises after blockier intensity weeks — don’t panic unless it persists >10 days.
HIIT and sprint-focused work
Typical RHR trajectory: smaller RHR reductions (0–3 bpm) since adaptations are more neuromuscular than purely aerobic.
How to use it: monitor for unexplained RHR increases plus worse sprint times or higher RPE — signs you need more recovery.
Real example: a cyclist adding weekly VO2 intervals saw only a 1–2 bpm RHR drop but a clear VO2 test improvement — trust the performance test over small RHR shifts.
Strength training
Typical RHR trajectory: minimal change or modest decreases (0–2 bpm); strength gains often occur without major RHR shifts.
How to use it: combine RHR with metrics like 1RM, bar speed, and subjective freshness; rising RHR with declining lifts = accumulated fatigue.
Mixed modalities (CrossFit, team sports)
Typical RHR trajectory: variable; look for patterns across weeks rather than single numbers.
How to use it: integrate RHR with session RPE and sleep data to guide programming adjustments.
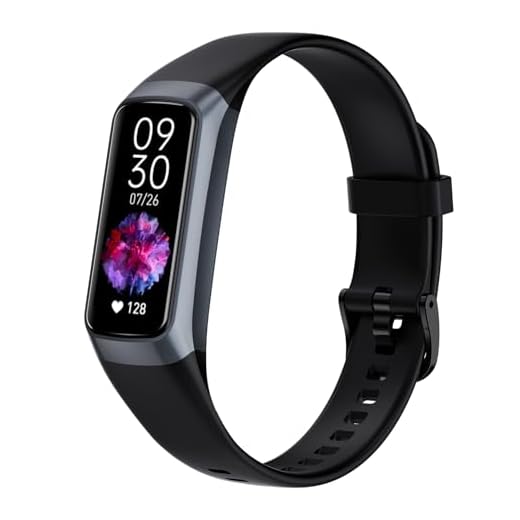
Must-Have
Smart Bracelet with 170+ Sports and Health Tracking
All-day HRV, blood oxygen, sleep, and GPS modes
Stylish smart bracelet offering continuous heart rate, HRV, blood pressure, blood oxygen, and sleep tracking along with 170+ sport modes and three GPS modes. Long battery life, IP68 water resistance, and two interchangeable bands make it versatile for everyday wear and workouts.
Special populations: adjust expectations and methods
Beginners vs experienced athletes
Beginners: larger, quicker RHR drops (3–8 bpm in 6–12 weeks) as basic aerobic fitness improves.
Experienced athletes: smaller but meaningful shifts (0.5–3 bpm); treat tiny changes as actionable.
Older adults
Expect smaller absolute declines; watch that RHR remains stable and recovery metrics (sleep, HRV) are strong. Use chest straps (Polar H10) for accuracy during testing.
Weight-class athletes
Rapid weight cuts often raise RHR (dehydration, stress). Track morning RHR plus body mass and urine color; rising RHR during a cut is a warning to slow the process.
Chronic conditions and medications
Beta‑blockers blunt HR responses — absolute RHR values will be lower and less responsive. Use relative change and combine with perceived exertion, functional tests (6‑minute walk), and clinician guidance.
For chronic illness (e.g., diabetes, COPD): prioritize symptom tracking and consult healthcare providers when RHR trends conflict with wellbeing.
Combine RHR with other metrics
Performance tests (time trials, 1RM), HRV trends, daily RPE, and sleep scores create the full picture.
Heuristic: positive signal = RHR down + HRV up + better test performance + lower RPE.
Caution signal = RHR up + HRV down + poorer results + higher RPE → reduce load.
Use these practical pairings to tailor expectations by goal and individual context, and you’ll turn a simple number into actionable training intelligence.
5
Practical Tracking Plan and Troubleshooting: From Data to Decisions
Step-by-step tracking plan
Follow this simple, coach-ready routine to turn morning numbers into better workouts.
Establish a baseline (2–4 weeks)
Take daily morning RHR measurements at the same time (first awake, before getting out of bed). Record posture (supine vs seated), device, and sleep hours.
Select a measurement protocol
Choose one device and method: wrist wearable (Garmin Forerunner 955, Apple Watch Series 9), chest strap (Polar H10) for greater spot accuracy, or spot‑check EKG for suspected arrhythmia.
Set realistic goals
Beginners: aim for a 3–8 bpm drop over 6–12 weeks. Trained athletes: 0.5–3 bpm over 8–12 weeks—smaller shifts can still be meaningful.
Visualize trends
Plot daily points with a 7‑day moving average in Excel, Google Sheets, or apps (Garmin Connect, Apple Health, Oura). Look for sustained trend changes, not day-to-day noise.
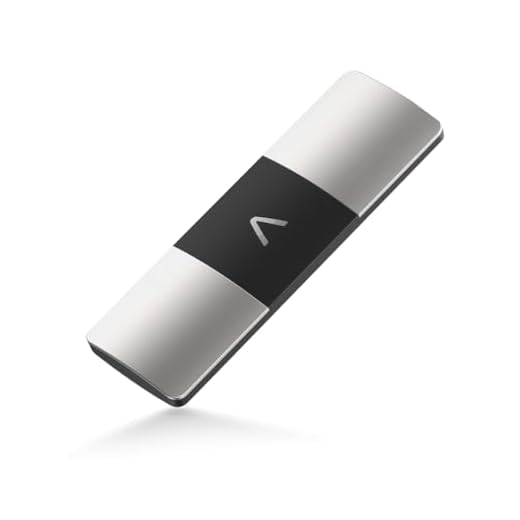
Portable, FDA-cleared six-lead EKG that records medical-grade heart rhythm readings in 30 seconds and helps detect AFib, bradycardia, and tachycardia. Works with most smartphones without a subscription, providing detailed data you can share with your clinician.
Push training when: RHR trends down or stable, HRV up, and performance markers improve for 2–4 weeks.
Back off when: RHR rises by ≥3 bpm above baseline for 3+ consecutive days AND coincides with poor sleep, lower HRV, or higher session RPE — reduce intensity or volume for 3–7 days.
Consult a healthcare professional when: RHR is persistently >100 bpm, sudden increases >10 bpm without clear cause, or any accompanying chest pain, fainting, or palpitations.
Troubleshooting common scenarios
Unexpected rises: check for recent alcohol, late meals, travel, or poor sleep. Retake measurement lying down after 5 minutes rest.
Noisy data: use 7‑day smoothing; remove obvious outliers (illness, travel days) when calculating baselines.
Sensor inaccuracies: validate wearables against a chest strap or manual radial pulse. Replace worn bands/electrodes.
Travel and timezones: use local morning readings but note travel days separately; expect transient rises for 2–5 days.
Acute illness or life stressors: expect RHR to rise. Treat these as signals to prioritize recovery; resume comparisons after full recovery.
Integrate into a training diary
Log RHR alongside session RPE, sleep, weight, and weekly performance tests (5K, FTP, 1RM). Set simple flags (green/yellow/red) based on your decision rules to make evidence‑based adjustments fast and routine—turning morning numbers into smarter training choices.
Resting heart rate is a low-cost, informative metric for tracking cardiorespiratory fitness when measured and interpreted consistently over time. Its value comes from trends rather than single values: accurate protocol, reliable baseline, context make RHR meaningful for assessing progress.
Start with a consistent measurement routine, build weeks of baseline data, and monitor for shifts. Combine RHR with training load, sleep, and symptoms before changing plans. Be patient—track and respond to trends, not individual readings.
Funny how people obsess over VO2 max but forget RHR is free and less dramatic. 😂
Two quick things: battery life on my AMOLED is meh when I use continuous HR; the Smart Bracelet with 170+ sports lasted longer for me. Also — are chest straps still gross in 2025 or is it just me being lazy? Asking for a friend.
LOL chest straps are still a thing because they’re accurate. But if convenience wins, modern wrist wearables (AMOLED/Smart Bracelet) do a fine job for daily RHR trends. For short, high-precision tests go chest strap; for passive daily monitoring go wrist.
Ethan Cole
on October 8, 2025
Chest straps can be uncomfortable but I air-dry them and they’re fine. If you’re training seriously, the tradeoff is worth it imo.
Grace Nguyen
on October 8, 2025
If you hate straps, try the Powr Labs for ANT+/Bluetooth pairing ease. Fewer excuses to skip measurements 😉
Sofia Patel
on October 9, 2025
Loved the bit about physiology — finally someone explained why RHR = autonomic balance and not just “fitness points”. Also lol at the suggestion to ‘measure at rest’ — like my cat doesn’t interrupt every morning 😂
On devices: I have the AMOLED Fitness Tracker and the HR readings are decent but if you want clinical accuracy get the Polar H10 or KardiaMobile for EKGs. My AMOLED likes to report superhero-level HR when I roll over in bed tho, so grain of salt.
Haha cats are the worst RHR assistants. Good take on device tiers: wrist PPG (AMOLED trackers) for trends, chest straps (Polar H10/Powr Labs) for accuracy, and KardiaMobile for rhythm/EKG checks.
Liam Brooks
on October 10, 2025
I’ve seen wrist sensors spike on movement too. If you can, take a 60s chest-strap reading after 5 min lying still — way fewer weird jumps.
Liam Brooks
on October 12, 2025
Solid article. A few constructive notes from someone who geeks out over data:
1) Clarify the difference between absolute RHR change and percent change for different populations (older vs younger).
2) For people using the 1.83″ HD Smartwatch with Alexa and Calling or similar smartwatches, remind them to disable notifications overnight — vibrations can mess with nocturnal RHR data.
3) If you’re measuring with bracelets, check strap placement. I had mine too loose and it read 7 bpm higher for weeks.
Also, shoutout to the ‘Troubleshooting’ section — saved me from overreacting when my RHR jumped for two days after a big omelette and no water 😂
Grace Nguyen
on October 12, 2025
Totally agree on percent vs absolute — even a 3 bpm drop matters differently if your baseline is 60 vs 80.
Great feedback, Liam. We’ll add a clearer note about absolute vs percent change and include a short checklist for wearable setup (fit, firmware, notifications).
Ethan Cole
on October 21, 2025
Question: how do you folks handle days when you’re sick or jet-lagged? My RHR spikes and then ruins my 30-day trend line lol. I’ve been thinking of keeping a separate tag in my app for ‘sick/travel’ so I can exclude those days from baseline calculations. Also curious if anyone uses KardiaMobile for more than just symptomatic checks — does the EKG add value to RHR trends?
Good question. Tagging is exactly what we recommend in the ‘Practical Tracking Plan’ — mark illness/travel and exclude those days from baseline. KardiaMobile is a different tool: it gives rhythm and conduction info, not continuous RHR trends. Use it when you notice unexplained persistent RHR shifts or palpitations.
Grace Nguyen
on October 21, 2025
I do the ‘exclude’ tag too. If I’m sick, I note symptoms in the app (cough, fever) and ignore that week’s data for long-term averages. KardiaMobile has helped me rule out stuff when my RHR went up 8 bpm for days — got checked and it was sinus tachy from dehydration, not arrhythmia.
Another small tip: consider a weighted baseline that discounts tagged days automatically — some tracker apps let you do that.
Marcus Lee
on October 22, 2025
Jet lag ruins everything. I usually add a ‘travel’ tag and then reset my 7-day baseline after 3 normal mornings back home. Works okay.
Grace Nguyen
on October 24, 2025
Neutral take: useful primer but I wanted more about how to integrate RHR with training load metrics (like TSS or weekly mileage). The ‘Using RHR to Track Different Training Goals’ bit touched on it, but an example protocol would help. For instance: if baseline increases 4 bpm while training load is up 30% -> scale back intensity X%.
Also curious if anyone has compared Powr Labs chest strap vs Polar H10 head-to-head?
Marcus Lee
on October 25, 2025
Head-to-head: I had both. Polar H10 felt more snug and consistent; Powr Labs paired more easily with my bike head unit. Accuracy felt similar in steady states but YMMV.
Good point. We intentionally kept it general to apply across different sports, but adding concrete example protocols is a great idea. We’ll draft a sample: RHR + acute:chronic load flags to suggest specific reductions (e.g., cut intensity by 20% if RHR ↑ ≥4 bpm and ACWR >1.3).
Maya Thompson
on November 13, 2025
Great read — finally something that treats RHR like an actual metric and not just a random number on my watch. I switched from a basic wrist tracker to a Polar H10 chest strap last year and my morning RHR dropped a few bpm as I improved endurance — seeing that change felt legit.
Tips for newbies: take it lying down first thing, do it for a week and use the median not the single lowest reading. Also, if you use the Powr Labs Bluetooth strap it paired way faster for me than my old ANT+ strap. 🙂
Ethan Cole
on November 13, 2025
Yep — +1 on the Polar H10. I find chest straps more consistent than wrist sensors for resting HR. Battery life on mine is excellent too.
Thanks for sharing your routine, Maya — exactly the kind of real-world example readers asked for. Quick note: when you say ‘median’, do you log RHR each morning and calculate median over 7 days? That’s the most robust approach to filter out outliers (illness, bad nights).
Also worth mentioning: chest straps like Polar H10 and Powr Labs are great for spot-checks if you’re doing short tests (e.g., post-workout vs rest). For long-term daily trends, an AMOLED fitness tracker or smart bracelet works fine as long as you standardize timing.


Funny how people obsess over VO2 max but forget RHR is free and less dramatic. 😂
Two quick things: battery life on my AMOLED is meh when I use continuous HR; the Smart Bracelet with 170+ sports lasted longer for me. Also — are chest straps still gross in 2025 or is it just me being lazy? Asking for a friend.
LOL chest straps are still a thing because they’re accurate. But if convenience wins, modern wrist wearables (AMOLED/Smart Bracelet) do a fine job for daily RHR trends. For short, high-precision tests go chest strap; for passive daily monitoring go wrist.
Chest straps can be uncomfortable but I air-dry them and they’re fine. If you’re training seriously, the tradeoff is worth it imo.
If you hate straps, try the Powr Labs for ANT+/Bluetooth pairing ease. Fewer excuses to skip measurements 😉
Loved the bit about physiology — finally someone explained why RHR = autonomic balance and not just “fitness points”. Also lol at the suggestion to ‘measure at rest’ — like my cat doesn’t interrupt every morning 😂
On devices: I have the AMOLED Fitness Tracker and the HR readings are decent but if you want clinical accuracy get the Polar H10 or KardiaMobile for EKGs. My AMOLED likes to report superhero-level HR when I roll over in bed tho, so grain of salt.
Haha cats are the worst RHR assistants. Good take on device tiers: wrist PPG (AMOLED trackers) for trends, chest straps (Polar H10/Powr Labs) for accuracy, and KardiaMobile for rhythm/EKG checks.
I’ve seen wrist sensors spike on movement too. If you can, take a 60s chest-strap reading after 5 min lying still — way fewer weird jumps.
Solid article. A few constructive notes from someone who geeks out over data:
1) Clarify the difference between absolute RHR change and percent change for different populations (older vs younger).
2) For people using the 1.83″ HD Smartwatch with Alexa and Calling or similar smartwatches, remind them to disable notifications overnight — vibrations can mess with nocturnal RHR data.
3) If you’re measuring with bracelets, check strap placement. I had mine too loose and it read 7 bpm higher for weeks.
Also, shoutout to the ‘Troubleshooting’ section — saved me from overreacting when my RHR jumped for two days after a big omelette and no water 😂
Totally agree on percent vs absolute — even a 3 bpm drop matters differently if your baseline is 60 vs 80.
We’ll add a small table in the follow-up post showing example interpretations by baseline RHR ranges — thanks for the idea.
Yes to disabling notifications — I turned off sleep alerts and my sleep HR got way cleaner. Had to learn that the hard way.
Also check firmware updates. My AMOLED had a weird HR algorithm bug fixed by an update.
Great feedback, Liam. We’ll add a clearer note about absolute vs percent change and include a short checklist for wearable setup (fit, firmware, notifications).
Question: how do you folks handle days when you’re sick or jet-lagged? My RHR spikes and then ruins my 30-day trend line lol. I’ve been thinking of keeping a separate tag in my app for ‘sick/travel’ so I can exclude those days from baseline calculations. Also curious if anyone uses KardiaMobile for more than just symptomatic checks — does the EKG add value to RHR trends?
Good question. Tagging is exactly what we recommend in the ‘Practical Tracking Plan’ — mark illness/travel and exclude those days from baseline. KardiaMobile is a different tool: it gives rhythm and conduction info, not continuous RHR trends. Use it when you notice unexplained persistent RHR shifts or palpitations.
I do the ‘exclude’ tag too. If I’m sick, I note symptoms in the app (cough, fever) and ignore that week’s data for long-term averages. KardiaMobile has helped me rule out stuff when my RHR went up 8 bpm for days — got checked and it was sinus tachy from dehydration, not arrhythmia.
Another small tip: consider a weighted baseline that discounts tagged days automatically — some tracker apps let you do that.
Jet lag ruins everything. I usually add a ‘travel’ tag and then reset my 7-day baseline after 3 normal mornings back home. Works okay.
Neutral take: useful primer but I wanted more about how to integrate RHR with training load metrics (like TSS or weekly mileage). The ‘Using RHR to Track Different Training Goals’ bit touched on it, but an example protocol would help. For instance: if baseline increases 4 bpm while training load is up 30% -> scale back intensity X%.
Also curious if anyone has compared Powr Labs chest strap vs Polar H10 head-to-head?
Head-to-head: I had both. Polar H10 felt more snug and consistent; Powr Labs paired more easily with my bike head unit. Accuracy felt similar in steady states but YMMV.
Good point. We intentionally kept it general to apply across different sports, but adding concrete example protocols is a great idea. We’ll draft a sample: RHR + acute:chronic load flags to suggest specific reductions (e.g., cut intensity by 20% if RHR ↑ ≥4 bpm and ACWR >1.3).
Great read — finally something that treats RHR like an actual metric and not just a random number on my watch. I switched from a basic wrist tracker to a Polar H10 chest strap last year and my morning RHR dropped a few bpm as I improved endurance — seeing that change felt legit.
Tips for newbies: take it lying down first thing, do it for a week and use the median not the single lowest reading. Also, if you use the Powr Labs Bluetooth strap it paired way faster for me than my old ANT+ strap. 🙂
Yep — +1 on the Polar H10. I find chest straps more consistent than wrist sensors for resting HR. Battery life on mine is excellent too.
Thanks for sharing your routine, Maya — exactly the kind of real-world example readers asked for. Quick note: when you say ‘median’, do you log RHR each morning and calculate median over 7 days? That’s the most robust approach to filter out outliers (illness, bad nights).
Also worth mentioning: chest straps like Polar H10 and Powr Labs are great for spot-checks if you’re doing short tests (e.g., post-workout vs rest). For long-term daily trends, an AMOLED fitness tracker or smart bracelet works fine as long as you standardize timing.