Measure Stress with Heart Rate & Skin Sensors — Quick Preview
This guide shows how to measure physiological stress using heart-rate (HR) and skin conductance (EDA/GSR) sensors, covering sensor selection, environment and protocol setup, baseline calibration, artifact-resistant data collection, and analysis to produce reliable, ethical stress metrics with clear practical steps.
What You’ll Need
Developing a Stress Monitoring System with Galvanic Skin Response and Heart Rate Sensors
Select the Right Sensors and Hardware
Not all wearables are equal — pick the right tech or your data will mislead you. Which sensor trade-offs matter most?Choose sensors that match your study goals and participant comfort.
Prefer ECG chest straps or single-lead adhesive patches for accurate beat-to-beat heart-rate and HRV; use PPG wristbands only when convenience and long-term wear matter.
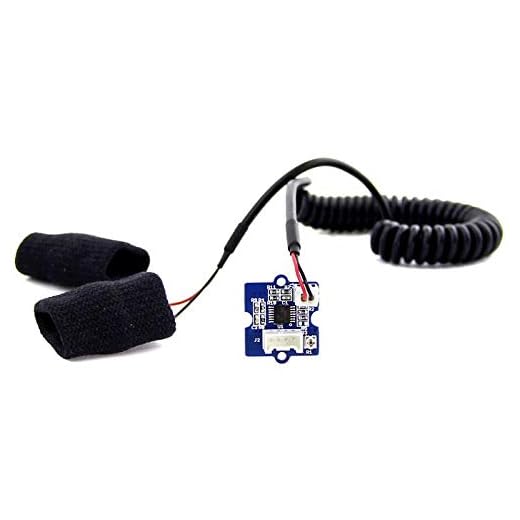
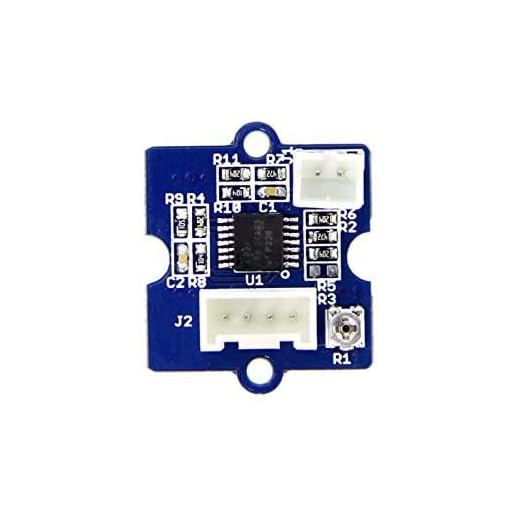
Use a dedicated EDA/GSR sensor with two electrodes on palmar surfaces or fingers for reliable skin-conductance signals.
Check these specifications before buying:
Consider budget and control: choose research-grade sensors for cleaner signals and consumer wearables when field convenience wins.
Compare options in context: for example, use an ECG strap in lab stress tasks but select a wrist PPG for ambulatory monitoring.
Read validation studies for any device before committing.
Prepare the Environment and Protocol
Want reliable stress signals? Control the room like a lab — tiny changes can wreck your measurements.Design a reproducible protocol and document every step before recruitment.
Keep temperature, lighting, and background noise stable; aim for ~22°C, neutral lighting, and <40 dB ambient noise.
Ask participants to avoid caffeine, heavy exercise, and nicotine for 3–6 hours before testing.
Define posture and clothing: request sitting or semi‑reclined posture and loose sleeves or short sleeves for sensor access.
Create a clear timeline and script for staff, for example:
Specify stressor type and standardize instructions: choose Trier Social Stress Test, timed mental arithmetic with evaluator, or a cognitive load task; fix durations and verbal prompts.
Train staff to apply sensors consistently, to mark event timestamps, and to log artifacts or participant comments.
Include ethical safeguards: obtain consent, allow participants to stop anytime, debrief after tasks, and encrypt/store physiological data securely.
Pre-test the full procedure on 1–2 people to catch logistical problems and refine timing.
Calibrate and Record Baseline Signals
Baseline isn't optional — it's your personal stress fingerprint. Ready to discover yours?Place sensors and let the participant rest quietly for a standardized 5–10 minute baseline.
Instruct slow, natural breathing or implement a paced breathing protocol (example: 6 breaths/min) if you plan to control for respiratory effects.
Record tonic EDA and resting HR/HRV during this quiet epoch and actively note artifacts such as movement, talking, coughs, or sensor adjustments.
Verify signal quality during the baseline by checking:
Adjust electrode placement or device gain/settings if signals are noisy, then re-record a short confirmation baseline (1–2 min).
Save a calibration file or event marker indicating the baseline window, and record demographics/covariates (age, medications, sleep, menstrual cycle).

Collect Task Data and Manage Artifacts
Movement ruins signals — but you can outsmart motion and noisy data with the right approach.Mark event onsets with synchronized timestamps across all devices (hardware trigger, TTL pulse, or network-synced clock).
Minimize unnecessary movement and instruct participants exactly when to speak or move (for example: “speak now” cue or raise hand to indicate a response).
Attach a motion sensor (3‑axis accelerometer) to flag movement artifacts and log participant-reported events (coughs, sensor adjustments, breaks).
Record continuous raw signals at the planned sampling rates and monitor traces during acquisition.
Inspect traces briefly after each block and redo any segment with gross failures (e.g., lost contact, flatline).
Back up raw files immediately and use clear folder naming, for example:
During preprocessing, remove or interpolate short artifacts, apply bandpass filtering for ECG/PPG (e.g., 0.5–40 Hz), and perform artifact rejection for EDA (remove spikes from electrode shifts).
Keep a separate log of excluded segments and reasons to ensure transparency and reproducibility.
Analyze Signals and Interpret Stress Metrics
Numbers tell a story: HRV dips? EDA spikes? Here’s how to turn signals into meaningful stress insights.Process signals with reproducible scripts (e.g., Python/NumPy, MNE, NeuroKit2) and store versioned code.
Detect R‑peaks in ECG or pulse peaks in PPG, and compute interbeat intervals (IBIs).
Compute time-domain HRV metrics such as RMSSD and SDNN, and derive frequency-domain bands (LF, HF, LF/HF) using Welch or multitaper PSD.
Interpret low RMSSD and low HF power as common markers of reduced parasympathetic tone during stress (for example: task vs baseline RMSSD drop).
Separate EDA into tonic (skin conductance level) and phasic responses; extract SCRs, count responses, measure amplitudes, latency, and recovery time.
Normalize all features to baseline or compute within‑subject z‑scores to control interindividual differences (for example: z = (task − baseline)/SD_baseline).
Combine HR and EDA features using simple rules (e.g., HR↑ + SCR count↑ → probable stress) or train statistical/ML models; always validate performance on held‑out data and report cross‑validation results.
Visualize continuous traces and event‑locked averages to inspect dynamics, and explicitly acknowledge that physiological signals are proxies influenced by posture, caffeine, medications, and are not diagnostic.
Repeat tests, perform cross‑validation, and report methods and ethics transparently.
Wrap-Up: From Signals to Insights
Following these steps yields reproducible HR and EDA stress measurements; validate methods, protect participant welfare, and interpret physiological markers cautiously — informative but not diagnostic. Try the protocol, refine it with your data, and share results to advance ethical stress assessment.
Artifact removal saved my project. I switched from simple thresholding to an approach combining accelerometer-based artifact flags + signal quality indices and got way better downstream HRV. Tip: log accelerometer axes separately for easy cross-checks.
Exactly — accelerometer + SQI works wonders. Also, consider rejecting very short epochs (<30s) that are problematic for frequency analysis.
Good reminder to time-sync accelerometer and physiological sensors carefully; otherwise cross-checks are meaningless.
If your sensors support it, increase sampling frequency during task windows to improve SQI and then downsample for storage.
Great tip, Owen. Using accelerometer flags is one of the most reliable ways to catch motion-related contamination. We’ll add an example snippet for combining AX flags with ECG/PPG SNR.
Very practical guide. A couple of nitpicks:
1) The calibration steps are a bit light on exact timings — you say “record baseline for several minutes” but what’s recommended for robust baseline HRV? 2) Artifact management — do you recommend manual inspection or automated algorithms first? I don’t trust black-box auto-cleaners.
Anyway, solid job, especially the example analyses in section 5.
I echo the 5–10 min baseline. For some people with arrhythmias you might need longer to get stable estimates. And yes, automated cleaners like Kubios or custom filters + manual inspection work well.
Automation first, manual afterwards — exactly. But if you plan many subjects, automating more will save your sanity even if you check samples manually.
Also adding: if you use paced breathing during baseline, mention that in the protocol — paced breathing can standardize respiratory influences on HRV.
Good points. For baseline HRV we recommend at least 5 minutes of seated rest for time-domain measures; 10 minutes if you plan frequency-domain analyses. For artifact cleaning: start with automated algorithms to flag bad segments, then manual review for ambiguous cases — combine both.
I found that 7 minutes is a sweet spot for my subject pool (young adults). Works well with LF/HF calculations without fatigue or boredom.
Short and sweet: followed the guide and got clean signals on my first try (woo!). The wrap-up helped me interpret results meaningfully. Thanks — I’ll be referencing this in my next lab meeting.
Fantastic — glad it helped! If you have specific results or questions from your lab meeting, feel free to share and we can discuss interpretations.
Congrats! If you want feedback on visuals or metrics for the meeting slides, happy to take a look.
Loved the section on environment prep — such a small thing but it makes a huge difference. Also lol at the “no coffee 30 min before” rule, my participants always sneak in an espresso 😂
Haha yes, maybe offer decaf as a compromise. Or just schedule them early morning so coffee’s part of the baseline 😂
Totally agreed. Small environmental controls prevent huge confounds. We added a checklist PDF in the resources — helps keep participants honest 😄
This guide is thorough and accessible. I ran a small pilot using the exact pipeline and got interpretable stress metrics. A few long thoughts below — sorry for the essay:
1) The explainers in section 5 on LF/HF interpretation were helpful, but please emphasize limitations: LF/HF is not a direct stress measure and is influenced by respiration and other factors.
2) For skin conductance, smoothing parameters matter — the guide’s defaults worked well for me but I had to lower the low-pass for rapid EDA phasic responses.
3) The wrap-up was motivating — I liked the “From Signals to Insights” narrative.
Minor nit: a few typos in the protocol timings (maybe a copy-paste issue). But overall stellar resource.
Typos happen — thanks for flagging so they can fix them.
Totally about LF/HF caveats. People love simple ratios but they hide complexity. Appreciate you calling that out.
Thanks for the detailed feedback, Nina — really helpful. We’ll add a stronger caveat about LF/HF and respiration, and check the protocol timings for typos. Glad the pipeline worked for your pilot!
Re: smoothing EDA — I usually try a range of cutoff frequencies and visually inspect phasic peaks. Different cohorts (older vs younger) sometimes need different parameters.
Also, depending on your task, consider using event-related SCR analysis rather than continuous LF/HF for stimulus-evoked stress.
Quick note: the “manage artifacts” section works wonders if you label events carefully. Spent two days trying to figure out where a spike came from because I forgot to log a participant cough. 😅
I always have a co-observer note down any actions (sips of water, movements). It seems small but saves hours later.
Yes — event logs and video (when ethical and consented) are lifesavers. We recommend a simple timestamped event sheet during collection.
I appreciated the practical tips on sensor placement. One constructive suggestion: include a short checklist image or printable card for field technicians. It’d make onboarding new staff much faster.
Yes please — images are worth a thousand words when training assistants. Even a 1-page cheat sheet helps avoid common placement mistakes.
Great idea — we actually have a printable checklist in our repo and will add a link to the article. Thanks for the suggestion!
Great walkthrough! I liked the Quick Preview — it set expectations well.
Question: when you recommend PPG vs ECG for heart rate, do you have a ballpark on how much accuracy we lose with wrist-worn PPG during light activity? Trying to pick hardware for a study with limited budget.
If you must use wrist PPG, add a strong artifact rejection step (see section 4) and maybe exclude short epochs with high movement. Saves money but costs extra processing time.
Thanks James — good question. Wrist PPG typically has higher motion artifacts and can introduce 5–15% error in HRV-derived metrics during light activity compared to chest ECG, depending on sensor quality and filtering. For controlled lab tasks, PPG can be fine; for fine-grained HRV analysis, ECG is safer.
I used a consumer wristband and found it ok for resting tasks, but once participants moved their arms the data got messy. Try to minimize wrist motion or use adhesive PPG if budget allows.
Nice step-by-step. Quick calibration question: when you ask participants to perform brief deep breaths for sensor sync, how many breaths are enough and at what pace? Also, any recommended respiratory belts that play nice with HR sensors?
You can also use a chest-mounted accelerometer as a cheap respiratory proxy if belts are too fiddly.
I use a simple stretch-band belt with a motion sensor and it’s been reliable. Just make sure it sits snugly to avoid slippage.
Good Q. For syncing, 3–5 deep breaths at a paced 6–8 breaths/min (inhale 5s, exhale 5s) usually creates a clear respiratory artifact for alignment. For belts, the Respiration Inductive Plethysmography (RIP) belts from companies like BIOPAC or custom elastic belts with a secured sensor are robust.
I tried to follow this guide with cheap sensors and ended up with 60% usable data lol. Not the guide’s fault — just a PSA: cheap ≠ easy. If you think you’ll cut corners on hardware, plan for way more participants or longer sessions.
Also, their tips on artifact rejection saved me a ton, but still — budget realistic expectations.
Agree. Budget sensors are tempting, but preprocessing becomes a full-time job. If possible, pilot a few participants to estimate usable-data rate before committing.
Thanks for the honesty, Aaron. That’s a common trade-off. We added a short section on sample size inflation to account for expected data loss with lower-cost devices — might help planning.
Another trick: combine cheap sensors with strict protocols (minimize movement, enforce baseline rest) to boost usable data proportion. Not perfect, but helps.
Also consider renting higher-end gear for a few sessions to benchmark your cheap setup — you’ll know whether it’s salvageable.